G-1: How Does It Look?
The goal of this lesson is to gain insight on how to change the appearance of GeoGebra and the objects within it. We will then cover some of the way you can share what you’ve made in GeoGebra with others.
Object Properties
When an object such as a point or line is created, there are several pieces of information stored with that object, describing how the object is defined and how to display the object. Basic properties of any object can be accessed by right-clicking (for Mac users, hold Ctrl and click) on an object.
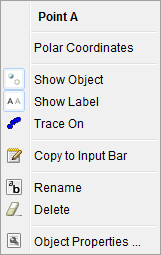
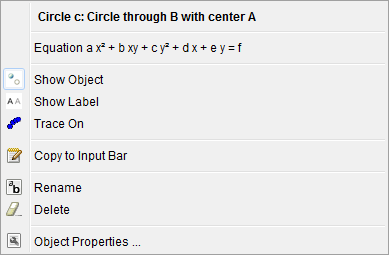
Create a circle using the ![]() Circle with Center through Point tool. Right-clicking on the center point or the circle will display the following properties and options:
Circle with Center through Point tool. Right-clicking on the center point or the circle will display the following properties and options:
The first line describes the type of Object, its name, and how it was defined (if applicable). The second line will change how the object appears in the Algebra View (if an alternate style is available, otherwise this line will not appear). Experiment with the remaining options, and open Object Properties when you are finished. (Object Properties can also be accessed by going to “Edit > Object Properties”)
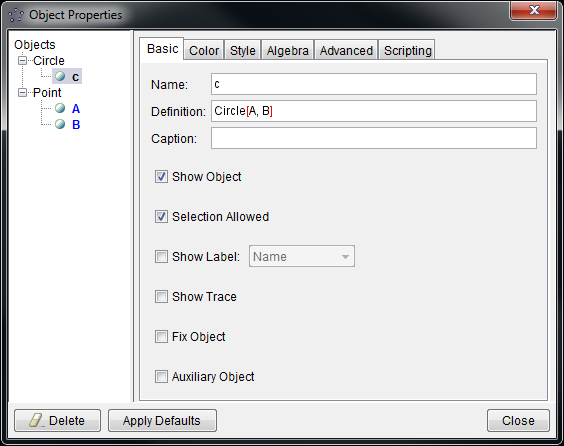
This window displays all objects created so far, and allows the user to modify the properties of the selected object. Alternatively, select one of the object types on the left to select all objects of that type.
Note that there are several tabs that can be accessed to change different properties. The tabs that appear depend on what type of object you select. Here is a brief description of a few tabs:
- Basic: Many of the properties in this tab you have already seen, so we note some new properties on this tab.
- The Definition text appearing in the above example is the text command that can be used to generate the object if you were to use the Input bar at the bottom of the GeoGebra Window.
- The Caption can be used as alternate label in the Graphics view, without having to change the name of the actual object. If you wrap the entire caption in single $ signs, it will format the caption as LaTeX Math! Note: you’ll also have to change “Show Label:” to “Caption” to see such a LaTeX caption.
- Select Fix Object to prevent the object from being moved from its current location.
- Auxiliary objects do not appear in the Algebra View in GeoGebra, and are generally Dependent Objects. Loci and points in Regular Polygons are automatically designated as auxiliary objects. Change the setting here if you would like the object to appear in the Algebra View
- Color: Choose a new color for the object.
- Style: Change the line thickness or size of an object, and change the fill (closed objects only) of an object.
- Advanced: Set conditions for which to show an object, and create dynamic colors based on variables. E.g. We could have the circle c appear when
Radius[c] <= 5. - Scripting: Program commands to execute when an object is clicked on or updated. E.g. When A is clicked, we could set
A:(0, 0), so that the point would return to the origin.
In addition to placing math in the caption of an object, a text box can be created using the ![]() Insert Text tool. Similar to the caption, either the entire text must be a LaTeX style math statement or just plain text. Make sure you select the LaTeX formula option in order to let GeoGebra know this is what you want.
Insert Text tool. Similar to the caption, either the entire text must be a LaTeX style math statement or just plain text. Make sure you select the LaTeX formula option in order to let GeoGebra know this is what you want.
Changing the View in GeoGebra
We know about the four standard areas of the GeoGebra window, described in lesson G-0: the Graphics view, the Algebra view, the Input bar and the Toolbar. There are other views and options we can access by going to “View” menu. The first seven options in the “View” menu will show or hide the respective objects they refer to.
The Spreadsheet view opens a spreadsheet that can be used to record data from the Graphics view, or send data to the Graphics view. It can also be used to analyze data, or create vectors and matrices.
The Construction Protocol lists all objects currently constructed, along with several columns of information relating to each object. By default, Name, Definition, Value, and Caption are shown, but the properties shown can be changed using the menu at the top-left corner of the window. If no menu exists in your version, right-click anywhere in the top header (“No.”, “Name”, “Definition” or “Value”) to access the menu.
Sharing your work
Sharing your GGB file directly
There are several different options when you wish to share the work you have created. For this course, we will have you submit a .ggb file, which is GeoGebra’s native file type. Saving this kind of file in GeoGebra Classic 5 is similar to most other applications; simply go to “File > Save”. However, be aware of how other users will see your work.
Size of GeoGebra Window
The size of the GeoGebra window when you’re working on your desktop is saved as part of your document. When you reopen the file, it sizes the window appropriately so that you can still see everything you could before.However, if another user opens your file and their screen is not large enough to handle the dimensions your work was saved at, all your objects will still exist, but their vision of your document could be cut off. This is of particular importance for those with very high-resolution screens.
The main recommendation to avoid this problem would be to not work with GeoGebra maximized. Size the window so that your construction doesn’t feel crowded but excess space is eliminated. If you drag the corner of the window, you should see an indication of how large the area you are working with is either in the title bar of the application or in the upper-left corner of the graphics area.
What is a good size? Many webpages cap their width at 900-1000px. In fact, this page is 768px wide.
Saving to your GeoGebra account
While saving to a .ggb file is a great way for you to submit your work to us within the context of this class, saving your work to a GeoGebra account online is the primary way to share content with students and other GeoGebra users.
If you are using the online version of GeoGebra or GeoGebra Classic 6, this will be the primary method for saving files (note that there are ways to still save to a .ggb file). If you have not already created an account, you will be prompted to create one when you attempt to save your file. This account will allow you to store any GeoGebra applications you make online, and provides the option to keep the work you create private, share your work with particular people, or to make your work fully open to anyone in the GeoGebra community.
Additionally, when you share your worksheet, you can limit how many of the controls that appear in the full editor appear to the user; this can be used to focus a student’s intention on the concept that you are getting them to investigate and prevent extraneous distraction.
Exporting an alternate format
These options can be located by going to “File > Export”:
- Graphics View as Picture (png, eps): This option allows you to export what is currently visible in the Graphics view as a picture. The two formats provided in the title are recommended formats for exporting. We do not recommend using this method to generate a pdf image, as little control is given over the resulting page size and orientation.
- Graphics View as Animated GIF: This option allows you to export what is currently visible in the Graphics view, with the condition that at least one slider is visible. When exporting, choose a visible slider to produced an animated image.
- Graphics View as PSTricks (PGF/TikZ, Asymptote): These options open a window, which can generate code that can be included in the appropriate program to generate the image seen in the Graphics view. It should be noted that changing the class to beamer for PSTricks or PGF/TikZ will produce a file showing how the diagram was constructed one object at a time.
Exercise (nickname: groovy)
- A free point ‘P’. Make the point’s size very large.
- A line ‘m’ through the origin and ‘P’. Hide the point at the origin, change the color of the line to red, and make it a dashed line.
- A circle. Hide any points used to create the circle, change the circle’s color to green, and make its interior semi-transparent.


